
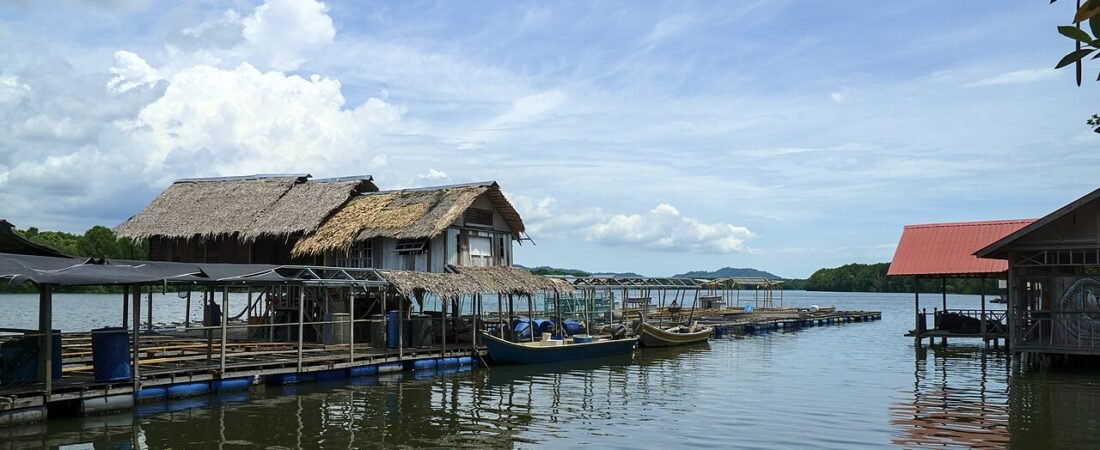
Oysters appear on Malaysian menus, but official figures show that local farm production is small, and it has been shrinking.
According to the Department of Fisheries Malaysia’s annual aquaculture statistics, published in the official OpenDOSM dataset, Malaysia produced 119.79 tonnes of farmed oysters in 2025. That was down from 140.86 tonnes in 2024 and 150.14 tonnes in 2023. The 2025 harvest was valued at RM1,379,690 at wholesale and RM1,667,380 at retail.
These figures cover brackishwater and marine farms registered with the Department of Fisheries. Production has not always been this low. The same official series recorded 1,568.28 tonnes in 2019, before output fell sharply from 2020 onwards and stayed well below 200 tonnes a year.
Oysters are also a small part of Malaysia’s farmed shellfish. In 2025, registered farms produced 18,694.20 tonnes of cockles and 7,021.51 tonnes of mussels — far more than oysters.
How this compares with the world
The picture looks even smaller beside global figures. In The State of World Fisheries and Aquaculture 2026, FAO reports that world aquaculture produced 8.193 million tonnes of oysters in 2024, up from 7.608 million tonnes in 2023. That was 40 percent of all farmed molluscs, which totalled 20.493 million tonnes in 2024. Cupped oysters (Crassostrea spp., reported as “cupped oysters nei”) were the world’s second-leading aquatic animal species in 2024, at 7.3 million tonnes, just behind whiteleg shrimp.
Malaysia’s 2024 farmed oyster output of 140.86 tonnes is therefore only a tiny share of global oyster aquaculture.
What we can — and cannot — say about consumption
It is reasonable to ask how much oyster Malaysia eats, and whether local farms meet that demand. A national oyster consumption figure was not found in the official sources opened for this article. The Department of Fisheries publishes import and export tables in Annual Fisheries Statistics Volume 2, but those files could not be retrieved at the time of writing, so apparent consumption (production plus imports, minus exports) cannot be calculated here. What the production data do show clearly is that local farm supply is modest and has declined in recent years.
The official dataset by state and culture system also does not list oysters on their own after 2018. From that year, oysters are grouped with cockles and siput sudu as kerang-kerangan, so a recent state-by-state or farm-area breakdown for oysters alone is not available in that public file.
Why hatchery seed and live microalgae matter
If Malaysia is to grow a more reliable oyster supply, farms need a steady source of healthy seed, not only spat collected from the wild. In a hatchery, oyster larvae and young spat depend on good-quality live microalgae as their feed. When the algae culture is stable, seed production is more consistent. When it crashes, a hatchery can lose a whole batch.
That is the work Aotracell focuses on. Aotracell is a Malaysian business in microalgae culture, oyster hatchery seed production, trading and consultancy. We help hatcheries and farms build a more dependable live-feed and seed supply for local oyster culture, including tools such as a microalgae continuous culture system.
If you run a hatchery or farm, or are planning one, and you would like to talk about seed or live microalgae feed, get in touch with Aotracell.
Sources
- Department of Fisheries Malaysia, annual aquaculture production by species, published on OpenDOSM (data as of 2025; last updated 10 October 2026). Dataset source: Department of Fisheries. CSV: aquaculture_production_species.csv.
- Department of Fisheries Malaysia, Annual Fisheries Statistics, Volume 1; and Volume 2 (Import and Export).
- OpenDOSM, Annual Aquaculture Production by State and Culture System (notes that, from 2018, cockles, siput sudu and oysters are reported together as kerang-kerangan).
- FAO. 2026. The State of World Fisheries and Aquaculture 2026 – Blue Transformation: turning vision into impact. Rome. https://doi.org/10.4060/cd8357en. Table 1.5: World production of major aquaculture species and main species groups. Underlying data: FAO FishStat, Global aquaculture production 1950–2024, accessed 28 March 2026.
- Image credit: Oyster farm at Bakau Hijau, Sungai Merbok, Sungai Petani, Kedah. Photo: Khairil Yusof, CC BY-SA 4.0, via Wikimedia Commons
